
Jan 12, 2016
Greg Palmer
D2iQ
4 min read
As companies move toward multi-tenant datacenters, or private clouds, in the name of improving IT efficiency, operational analytics become increasingly important. The people in charge of running datacenters and managing budgets want to know what services are running, who's running them, and how much resources they're consuming. This is why when you deploy applications or containers in a Mesosphere Datacenter Operating System (DCOS) cluster, you can tag or label your components in order to track and report usage.
For example, you may want to assign a cost-center identifier or a customer number to a Mesos application, and then produce a summary report at the end of the month. The report could include usage metrics such as the amount of CPU and memory allocated to the applications by cost center or customer. Going a step further, you can use the REST API or JSON payload to interact with analytics tools like Splunk or Jaspersoft, giving you a simple and powerful way to analyze your task data.
Here's how.
Assigning labels to applications and tasks
Mesosphere DCOS includes Marathon for deploying and monitoring long-running and containerized applications. You can use the Marathon web interface to deploy applications manually, or you can use the Mesosphere DCOS Marathon command line interface.
[caption id="attachment_4070" align="alignnone" width="800"]
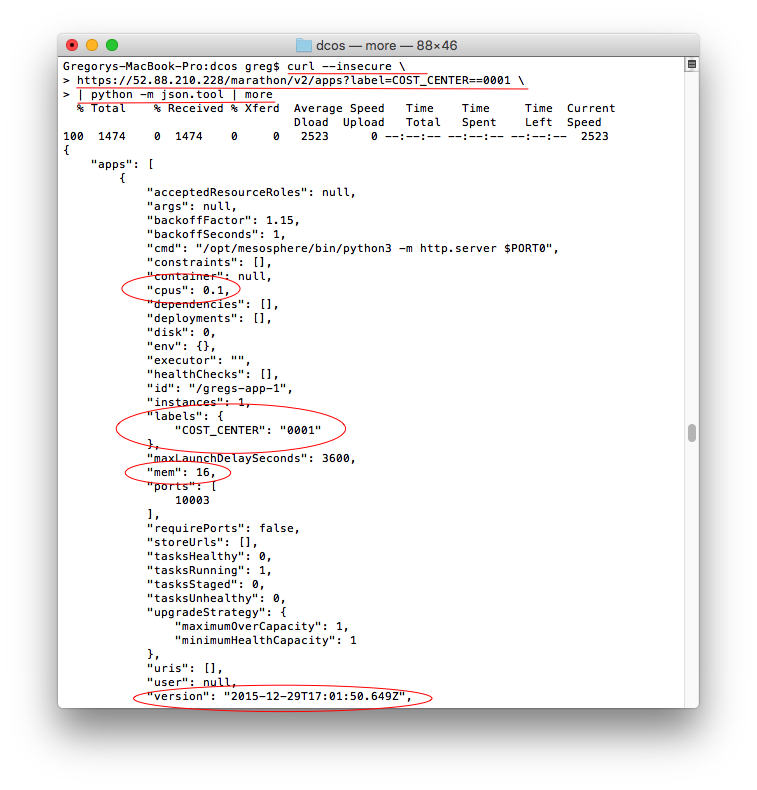
Figure 1. Marathon web interface - Labels for Application 1[/caption]
Figure 1 shows how to use the Marathon web interface to specify a label when launching a container or command line application. For the application named gregs-app-1, you can see that a label named COST_CENTER has been defined and set to 0001. When this application is deployed, it will have that cost center value associated with it and can be queried using the Marathon REST API.
Figure 2 shows a second application being deployed using the Marathon web interface, but this time it has a COST_CENTER label set to 0002. This label and value will be shown in the Marathon web interface and returned by calls to the REST API.
[caption id="attachment_4071" align="alignnone" width="800"]
Figure 2. Web interface – Labels for Application 2[/caption]
You can also specify the label values when you deploy the application using the Mesosphere DCOS command line interface like this:
dcos marathon app add <my json file>
Figure 3 shows the JSON format to use with the Mesosphere DCOS command to deploy an application using Marathon. Just as on the Marathon web interface, you can specify more than one label, but each label can only have one value.
[caption id="attachment_4072" align="alignnone" width="800"]
Figure 3. Marathon JSON File for Application 2[/caption]
Displaying label information
Now that the applications are deployed and started, you can use the Marathon web interface included with Mesosphere DCOS to view the two applications running with their associated labels. Figure 4 shows the applications running with their COST_CENTER label values displayed.
[caption id="attachment_4073" align="alignnone" width="800"]
Figure 4. Marathon web interface – Running Applications[/caption]
You can also use the Marathon REST API to query the running applications based on the label value criteria. Figure 5 shows a REST request issued to the Marathon service running in the Mesos cluster. The curl program is used in this example to submit the HTTP GET request, but you can use any program that is able to send HTTP GET/PUT/DELETE requests. You can see the REST end-point is:
https://52.88.210.228/marathon/v2/apps
And the parameters sent along with the REST request include the label criteria:
?label=COST_CENTER==0001
[caption id="attachment_4074" align="alignnone" width="757"]
Figure 5. Marathon REST API Usage[/caption]
You may also specify multiple label criteria like this:
?label=COST_CENTER==0001,COST_CENTER==0002
When the HTTP GET request is received by Marathon, it replies with a response in the form of a JSON payload. JSON wasn't designed to be easy to read, but if you use a tool like the python json.tool class, you can format it so it can be somewhat readable. In a real production system, you would have a reporting tool that knows how to decode the JSON formatted response into a nice human readable format (or chart), but here we are just viewing the raw JSON output.
As you can see, the response includes only the applications that have a label COST_CENTER defined with a value of 0001. The resource metrics are included too, such as the number of CPU shares and the amount of memory allocated. At the bottom of the response, you can see the date/time this application was deployed, which can be used to compute the uptime for billing or charge-back purposes.
Summary
As you can see, by running applications or containerized services on the Mesosphere DCOS and Marathon, it's possible to track cluster resource usage for charge-back or billing purposes. This will matter quite a bit going forward, as more companies adopt private clouds, multi-tenant datacenters, and containerized workloads in order to slash resource costs and improve operational efficiency. Having applications share resource is great, but having them share resources fairly is even better.